

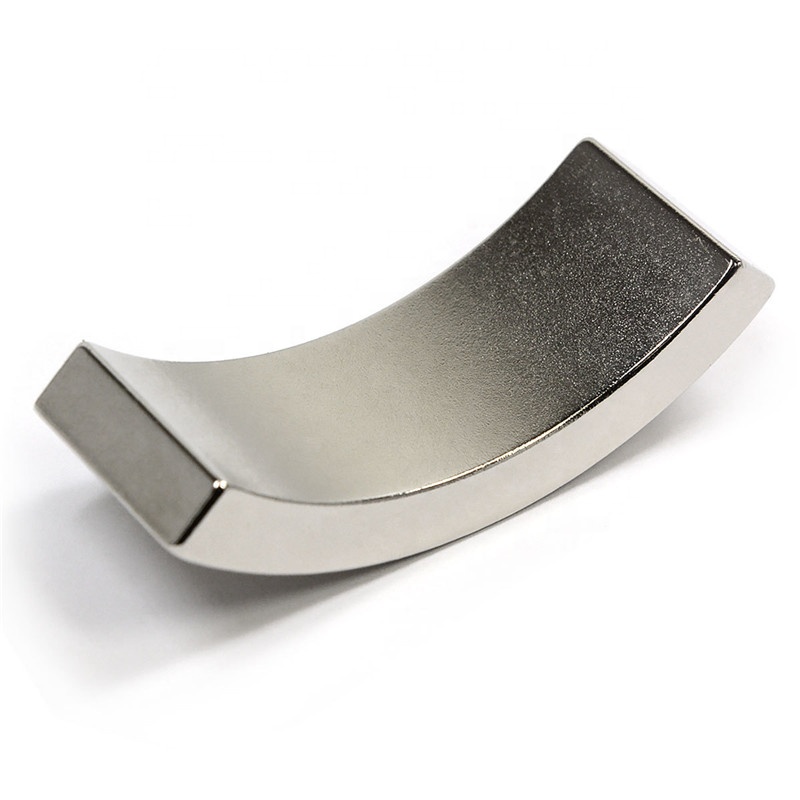
A permanent magnet datasheet often contains several magnetic properties, including remanence (Br), coercivity (Hc), intrinsic coercivity (Hcj), and maximum energy product (BHmax). These values describe different aspects of magnetic performance, but they are easier to understand when viewed together on a permanent magnet BH curve.
A permanent magnet BH curve shows how magnetic flux density changes in response to an applied magnetic field. For permanent magnet design, the second quadrant of the hysteresis loop is particularly important because it represents the magnet’s demagnetization behavior under an opposing magnetic field.
Understanding how to analyze a permanent magnet BH curve helps engineers interpret magnet datasheets, compare magnetic properties under consistent conditions, and understand whether a material is suitable for a particular design.
This guide explains the main parts of a magnet demagnetization curve, the meaning of Br, HcB, Hcj, and BHmax, and the practical considerations that matter when comparing permanent magnets.
What Is a Permanent Magnet BH Curve?
A permanent magnet BH curve describes the relationship between magnetic flux density (B) and magnetic field strength (H) in a magnetic material.
- B — Magnetic flux density: Measured in tesla (T) or gauss (G).
- H — Magnetic field strength: Measured in amperes per meter (A/m) or oersteds (Oe).
A complete B-H hysteresis loop describes how a material responds as the applied magnetic field changes through a magnetization cycle. For permanent magnet applications, engineers commonly focus on the second-quadrant portion of the loop, known as the demagnetization curve.
In this region, the magnetic flux density is generally positive while the applied field is opposing the magnet’s magnetization. The curve shows how the magnet’s magnetic output changes as the opposing field increases.
A supplier’s datasheet may show a normal B-H curve, an intrinsic J-H curve, or both. These curves are related, but they do not represent exactly the same quantity.
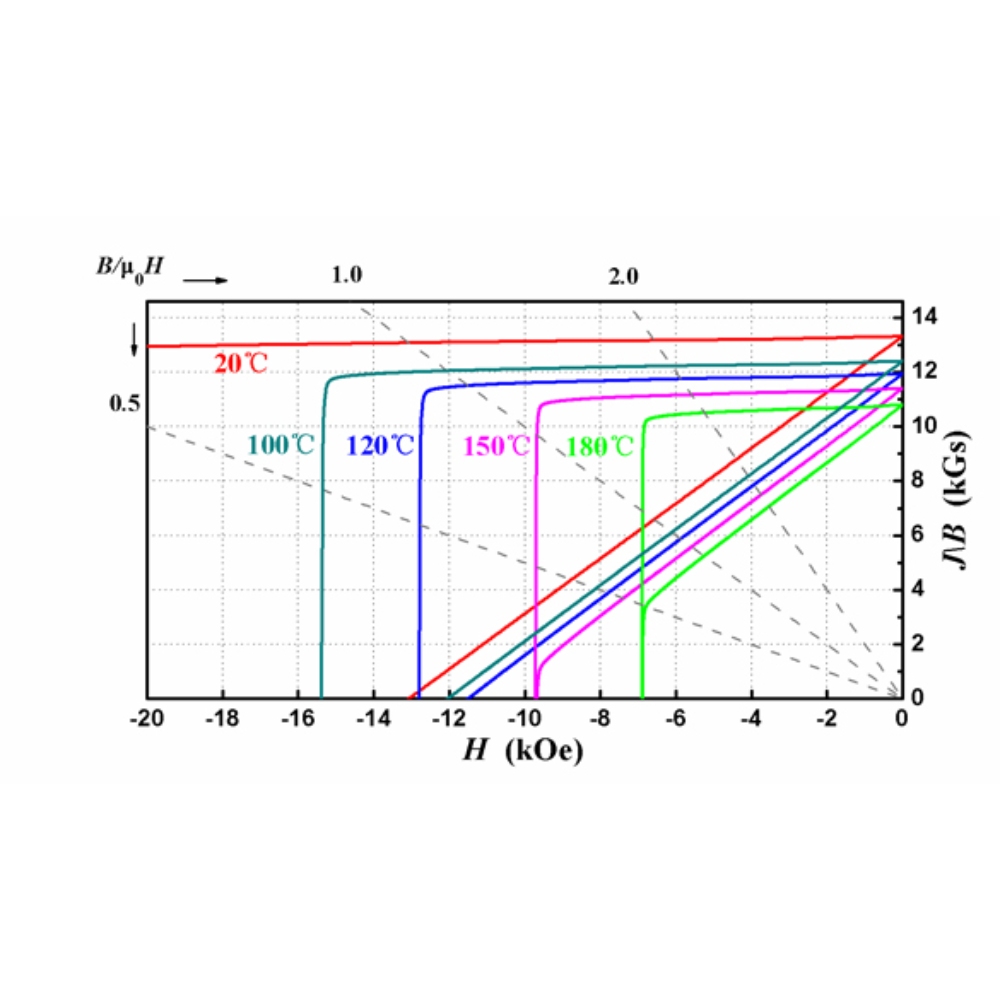
How to Read a Magnet Demagnetization Curve
When reading a permanent magnet BH curve, first identify the axes, the curve type, and the operating temperature.
The horizontal axis represents magnetic field strength, H. In the second quadrant, the demagnetizing field is conventionally shown with negative values. The vertical axis represents magnetic flux density B for the normal curve or magnetic polarization J for the intrinsic curve.
The most useful reference points are:
- Br: The normal curve’s vertical-axis intercept at H = 0.
- HcB: The horizontal-axis intercept of the normal B-H curve, where B = 0.
- Hcj: The horizontal-axis intercept of the intrinsic J-H curve, where J = 0.
- (BH)max: The maximum absolute product of B and H along the normal demagnetization curve.
These parameters describe different properties. Br indicates remanent flux density, HcB indicates normal coercivity, Hcj indicates intrinsic resistance to demagnetization, and BHmax describes the maximum energy product.
Do not compare the numbers without first checking whether the curves refer to the same material grade, temperature, and test conditions.
What Does Br Mean on a Magnet Datasheet?
Br stands for remanent flux density, also called residual induction. It is the magnetic flux density remaining when the magnetizing field H has returned to zero after the material has been magnetized to saturation under the specified measurement conditions.
On a normal B-H demagnetization curve, Br is found where the curve intersects the vertical B axis at H = 0.
Br is commonly reported in tesla (T) or gauss (G), with:
1 T = 10,000 G
A higher Br generally indicates a greater potential flux density from a given magnet material under comparable conditions. However, Br alone does not determine the magnetic field that a finished assembly will produce. Magnet geometry, the magnetic circuit, air gaps, leakage flux, and the operating point all affect the field in the application.
When comparing two datasheets, check that the Br values refer to the same temperature and comparable test conditions.
What Is Coercivity HcB?
The term coercivity can be used in different ways, so it is important to check the notation used in a magnet datasheet.
Normal coercivity, commonly written as HcB or Hcb, is the magnitude of the opposing magnetic field at which the normal magnetic flux density B falls to zero.
On the normal B-H demagnetization curve, this is the horizontal-axis intercept.
HcB describes the point where the net magnetic flux density B becomes zero under the applied opposing field. It does not mean that the material’s intrinsic magnetization has necessarily fallen to zero.
This distinction is important because the normal curve includes the contribution of the applied field, whereas the intrinsic curve describes the material’s magnetic polarization.
HcB vs. Hcj: What Is the Difference?
HcB and Hcj are both coercivity-related parameters, but they are defined using different curves.
| Parameter | Meaning | Curve used |
|---|---|---|
| HcB (or Hcb) | Normal coercivity: the opposing field at which B = 0 | Normal B-H curve |
| Hcj (also written Hci in some datasheets) | Intrinsic coercivity: the opposing field at which intrinsic polarization J = 0 | Intrinsic J-H curve |
Hcj is commonly used to evaluate a permanent magnet material’s resistance to irreversible demagnetization. A material with higher Hcj generally tolerates a stronger opposing magnetic field before its intrinsic magnetization is driven to zero, under the specified test conditions.
However, Hcj should not be interpreted as a universal guarantee that a magnet will remain stable in every application. The actual risk of irreversible demagnetization also depends on temperature, magnet geometry, the magnetic circuit, and the operating point.
For this reason, engineers should check both coercivity parameters when the datasheet provides them, especially for designs exposed to high temperatures or strong opposing fields.
What Is Maximum Energy Product (BHmax)?
The maximum energy product, written as (BH)max or BHmax, is the maximum value of the product of magnetic flux density B and the magnitude of magnetic field strength H along the normal demagnetization curve.
It is a useful measure of the magnetic energy product available from a permanent magnet material. In general, a higher BHmax can allow a smaller magnet volume for a particular magnetic design, but it does not by itself determine the required magnet size.
The value is typically reported in megagauss-oersteds (MGOe) or kilojoules per cubic meter (kJ/m³).
A common conversion is approximately:
1 MGOe ≈ 7.96 kJ/m³
On the curve, BHmax corresponds to the point where the absolute product |B × H| reaches its maximum. It is often illustrated as the largest rectangle that can be constructed under the normal demagnetization curve, using the magnitudes of B and H.
For an ideal straight demagnetization line, the maximum energy product occurs near the midpoint of the line. Real curves may deviate from this ideal, so use the supplier’s stated value or measured curve rather than assuming the midpoint always gives the exact result.
BHmax should not be treated as a direct measurement of holding force, pull force, or the field strength at a specific working distance. Those outcomes depend on the magnet and the complete magnetic circuit.
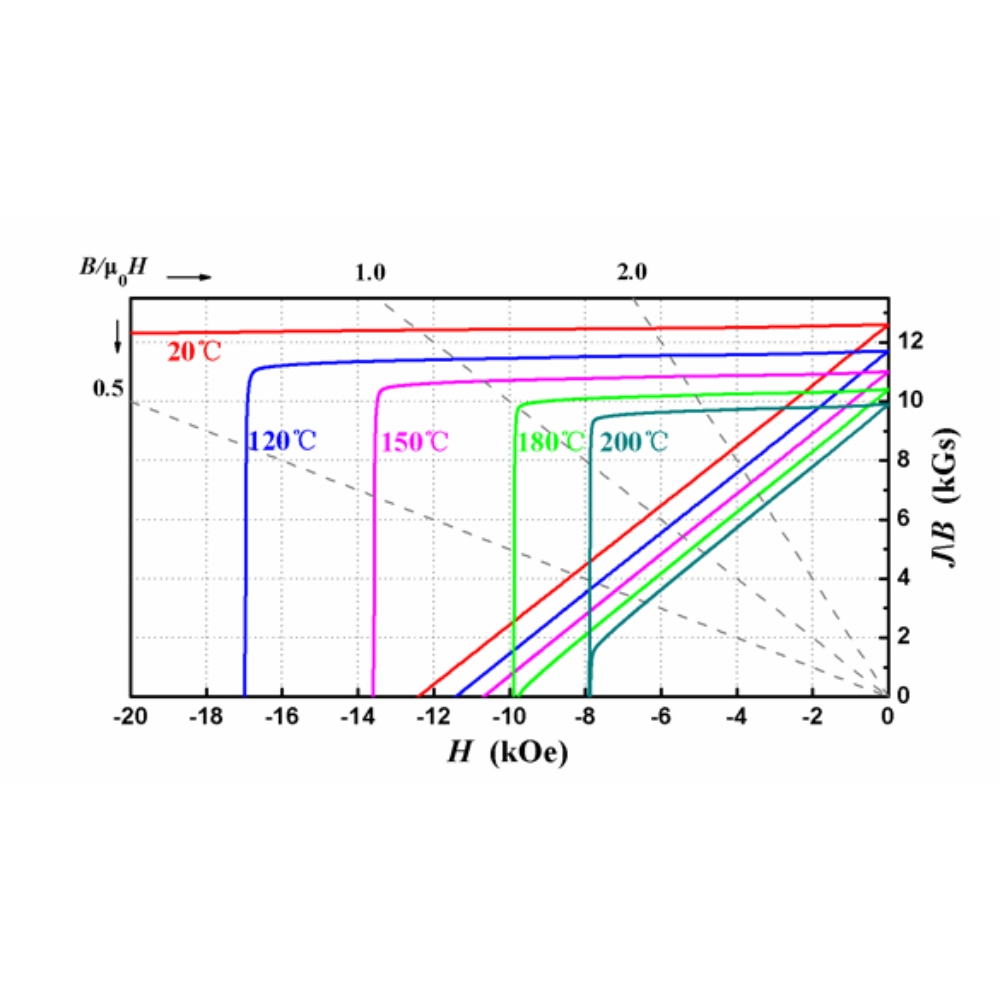
Normal vs. Intrinsic Demagnetization Curves
Many permanent magnet datasheets show two curves: the normal B-H curve and the intrinsic J-H curve.
The normal curve relates magnetic flux density B to the applied magnetic field H. It is commonly used to understand the magnet’s net magnetic output and to evaluate its operating point in a magnetic circuit.
The intrinsic curve relates magnetic polarization J to H. It provides additional information about the magnet material’s intrinsic demagnetization behavior.
In SI units, the relationship between the quantities is commonly expressed as:
B = J + μ₀H
where μ₀ is the permeability of free space, when J denotes magnetic polarization.
The two curves therefore have different horizontal-axis intercepts: HcB is defined where B = 0, while Hcj is defined where J = 0.
If a datasheet includes both curves, do not read HcB from the intrinsic curve or Hcj from the normal curve. Doing so confuses two different properties.
What Is the Knee of a Demagnetization Curve?
The knee is the region where the demagnetization curve begins to bend away from its relatively linear portion. Its location and shape can be important when evaluating the risk of irreversible demagnetization.
If a magnet’s operating point moves beyond the knee under an opposing field or at elevated temperature, some of its magnetization may not recover when the field or temperature returns to its previous condition.
The knee is not represented by one universally interchangeable parameter across every manufacturer or material grade. Its exact definition and measurement method may vary. When the knee matters to a design, review the actual curve at the relevant temperature and ask the supplier for the applicable test or design criteria.
Do not rely on Br or BHmax alone to determine whether a magnet will resist demagnetization in service.
How Temperature Changes a Permanent Magnet BH Curve
Permanent magnet properties vary with temperature. A datasheet may therefore include several demagnetization curves measured or specified at different temperatures.
As temperature changes, Br and coercivity can change, and the curve’s knee may move. The size and direction of these changes depend on the magnet material and grade.
For a design that operates above room temperature, compare curves at the expected operating temperature rather than relying only on a room-temperature specification. Also distinguish between reversible changes that occur with temperature and irreversible demagnetization that may remain after the magnet cools.
For a detailed explanation of temperature effects, see our guide to how temperature affects the performance of a neodymium magnet.
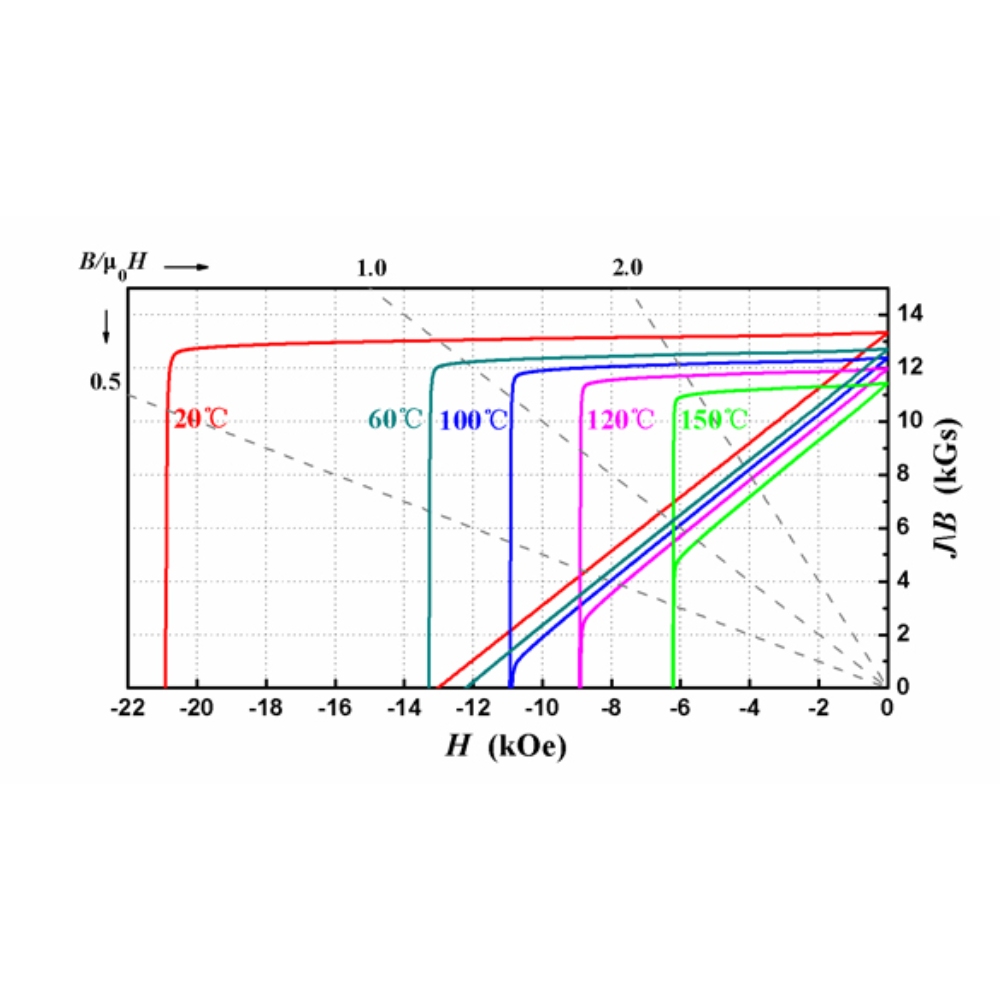
How to Compare Permanent Magnet BH Curves
When comparing two permanent magnet materials or grades, use a consistent process.
1. Confirm the Material Grade
Check the full grade designation and material family. Similar-looking grade names do not necessarily have identical magnetic properties.
2. Match the Temperature
Compare the curves at the same temperature. A room-temperature curve should not be directly compared with a curve measured at an elevated temperature.
3. Check Br and BHmax Together
Br indicates remanent flux density, while BHmax indicates the maximum energy product. Neither value alone provides a complete assessment of the magnet’s suitability.
4. Check HcB and Hcj
Review normal and intrinsic coercivity, especially if the design may encounter opposing magnetic fields or elevated temperatures.
5. Examine the Knee and the Full Curve
Two materials with similar headline specifications can behave differently near the knee. Inspect the full curve when demagnetization margin is important.
6. Evaluate the Operating Point
The actual operating point depends on the magnet’s geometry and the surrounding magnetic circuit. A material’s datasheet curve is a starting point, not a substitute for application-specific magnetic analysis.
7. Verify the Test Conditions
Check units, measurement temperature, material standard, and whether the values are typical, minimum, or guaranteed values. For critical applications, request appropriate test documentation from the supplier.
Common Mistakes When Reading a BH Curve
Avoid these common interpretation errors:
- Treating HcB and Hcj as interchangeable.
- Assuming a higher Br automatically means a better magnet for every application.
- Comparing BHmax values without checking temperature and units.
- Assuming a room-temperature curve guarantees high-temperature stability.
- Treating the knee as identical across all materials and manufacturers.
- Assuming datasheet values alone determine the magnetic field or force of a finished assembly.
A BH curve is most useful when its parameters are interpreted together and evaluated against the real operating conditions.
Conclusion
A permanent magnet BH curve brings several important magnetic properties together in one graph. Br describes remanent flux density, HcB identifies the normal coercivity, Hcj indicates intrinsic coercivity, and BHmax represents the maximum energy product.
The normal and intrinsic demagnetization curves provide related but different information. Understanding which curve is being shown—and how temperature and the actual operating point affect the magnet—helps engineers read datasheets more accurately and make better design decisions.
When comparing permanent magnets, review the full curve, confirm the measurement conditions, and evaluate the material in the context of the complete magnetic circuit rather than relying on a single headline specification.
Frequently Asked Questions
What is a permanent magnet BH curve?
It is a graph showing the relationship between magnetic flux density B and magnetic field strength H. The second quadrant is commonly used to represent the demagnetization behavior of a permanent magnet.
What does Br mean on a magnet datasheet?
Br is remanent flux density, or residual induction. It is the value of B at H = 0 on the normal demagnetization curve under the specified measurement conditions.
What is the difference between HcB and Hcj?
HcB is the opposing field at which the normal flux density B reaches zero. Hcj is the opposing field at which intrinsic polarization J reaches zero. They are read from different curves.
What does BHmax tell you?
BHmax is the maximum product of B and the magnitude of H along the normal demagnetization curve. It is a useful material performance metric, but it does not directly specify holding force or field strength at a particular distance.
Why do magnet datasheets show curves at different temperatures?
Because remanence, coercivity, and the shape of the demagnetization curve change with temperature. The curve at the actual operating temperature is important when assessing performance and irreversible demagnetization risk.